Grafana: Monitor SNMP devices with Telegraf and InfluxDB
Contents
My current setup is using Munin as monitoring solution. Although it is a very stable and useful tool, I sometimes miss a more dynamic view on graphs.
In this post, I’ll show how to use a stack consisting of InfluxDB, Telegraf and Grafana to monitor SNMP devices like a Router.
Requirements
First of all you need to have a running InfluxDB1, Telegraf2 and Grafana3 installation.
Furthermore you should install some tools we will use laster:
The Debian Wiki4 describes the required steps to install snmp and enable OID lookup.
Configuration
You don’t have to configure InfluxDB and Grafana as the default configurations work for us now.
As for now you can replace /etc/telegraf/telegraf.conf with this minimal configuration we will extend later:
[outputs]
[outputs.influxdb]
    # The full HTTP endpoint URL for your InfluxDB instance
    url = "http://localhost:8086"
    # The target database for metrics. Telegraf will create the DB if it does not exist
    database = "telegraf"
Find SNMP properties
For the following example I assume that your SNMP device has the IP 192.168.1.250 and that we want to monitor the network interfaces (in/out traffic).
First of all we need to find out, where to find those propertiey. Snmpwalk is a quite handy tool for this task.
snmpwalk -v2c -cpublic 192.168.1.250

SNMPv2-MIB::sysDescr.0 = STRING: GS108Tv2
SNMPv2-MIB::sysObjectID.0 = OID: SNMPv2-SMI::enterprises.4526.100.4.18
DISMAN-EVENT-MIB::sysUpTimeInstance = Timeticks: (1633967600) 189 days, 2:47:56.00
SNMPv2-MIB::sysContact.0 = STRING:
SNMPv2-MIB::sysName.0 = STRING: GS108Tv2
...
IF-MIB::ifName.1 = STRING: lo
IF-MIB::ifName.2 = STRING: green0
IF-MIB::ifName.3 = STRING: red0
IF-MIB::ifName.4 = STRING: orange0
...
In the output you can see, that all network related metrics can be found in the IF-MIB:: object. A quick look into the documentation reveals, that the table we are interested in is called ifXTable and the relevant fields are ifHCInOctets and ifHCOutOctets
You can verify the output by running the snmptable command.
snmptable -v 2c -c public 192.168.1.250 IF-MIB::ifXTable

 ifName ifInMulticastPkts ifInBroadcastPkts ifOutMulticastPkts ifOutBroadcastPkts   ifHCInOctets ifHCInUcastPkts ifHCInMulticastPkts ifHCInBroadcastPkts  ifHCOutOctets ifHCOutUcastPkts ifHCOutMulticastPkts ifHCOutBroadcastPkts ifLinkUpDownTrapEnable ifHighSpeed ifPromiscuousMode ifConnectorPresent     ifAlias ifCounterDiscontinuityTime
     g1           2054852            294756             544677              47092 14713365089657     10953313459             2054852              294756  2650730235299       7161947154               544677                47092                enabled        1000              true               true 01-Fritzbox               0:0:00:00.00
     g2            917352            710715           13731177             782117  4204012429022      8266252557              917352              710715 15012426720814      11723030894             13731177               782117                enabled        1000              true               true      02-NAS               0:0:00:00.00
...
Add SNMP to Telegraf
There are two plugins for Telegraf that can be used for SNMP:
We will use the later one but be aware that if you search for additional examples, you might find several with the old syntax.
Our goal is to store the ifXTable in Influx using the following tag:
snmp,agent_host=192.168.1.250,host=grafana,hostname=GS108Tv2,ifName=
So you can add the following configuration to your telegraf.conf:
[[inputs.snmp]]
  agents = [ "192.168.1.250:161" ]
  version = 2
  community = "public"
  name = "snmp"

 [[inputs.snmp.field]]
    name = "hostname"
    oid = "RFC1213-MIB::sysName.0"
    is_tag = true

  [[inputs.snmp.table]]
    name = "snmp"
    inherit_tags = [ "hostname" ]
    oid = "IF-MIB::ifXTable"

    [[inputs.snmp.table.field]]
      name = "ifName"
      oid = "IF-MIB::ifName"
      is_tag = true
You can now test the configuration using the --test switch of telegraf.
telegraf --test

> snmp,agent_host=192.168.1.250,host=grafana,hostname=GS108Tv2,ifName=g1 ifConnectorPresent=1i,ifCounterDiscontinuityTime=0i,ifHCInBroadcastPkts=0i,ifHCInMulticastPkts=0i,ifHCInOctets=136744395788i,ifHCInUcastPkts=584587575i,ifHCOutBroadcastPkts=0i,ifHCOutMulticastPkts=0i,ifHCOutOctets=1540859273292i,ifHCOutUcastPkts=1051656681i,ifHighSpeed=1000i,ifInBroadcastPkts=0i,ifInMulticastPkts=0i,ifName="g1",ifOutBroadcastPkts=0i,ifOutMulticastPkts=0i,ifPromiscuousMode=2i 1481107591000000000
...
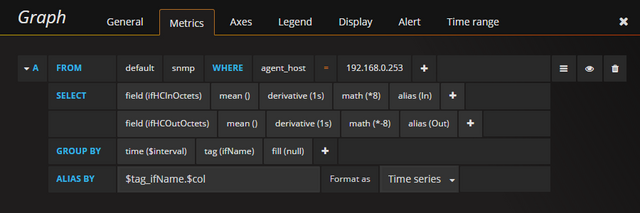
Configure Grafana to show data
The fields ifHCInOctets and ifHCOutOctets count, how many Octects are received/send on the interfaces. To get a bit/sec value, we need to do some calculations in Grafana but thats rather straight forward.
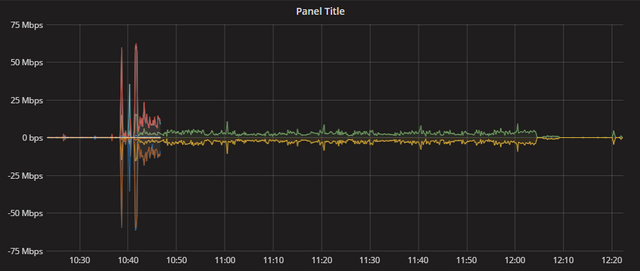
If everything works as expected, you should now see a graph as output.
Comments