Grafana: Monitor a Cisco ASA with Telegraf and InfluxDB
Contents
Some weeks ago I added several SNMP devices to my monitoring using telegraf1, influxDB2 and Grafana3 and documented the approach in this blog post.
Requirements
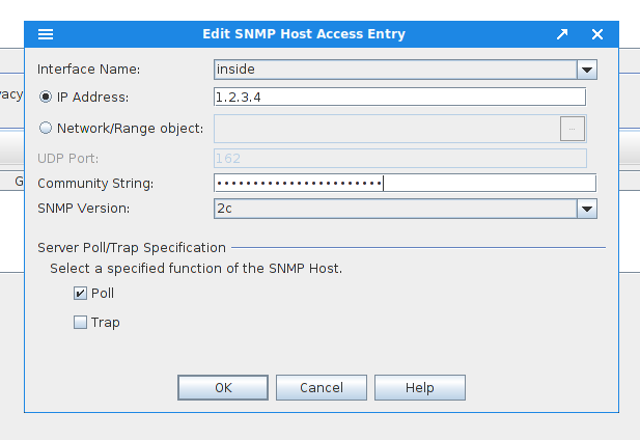
This is a follow up post, so all requirements from the original post are still valid. Furthermore you have to activate SNMP in your Cisco ASA.
Basic network monitoring
Telegraf configuration
The basic network metrics are stored in the ifXTable we already used. Our goal is to store the data in Influx using the following tags:
snmp,agent_host=192.168.1.250,host=grafana-dev,hostname=asa-dev,ifName=
So you can add the following configuration to your telegraf.conf:
[[inputs.snmp]]
  agents = [ "192.168.0.1:161"]
  version = 2
  community = "public"
  name = "snmp"

 [[inputs.snmp.field]]
    name = "hostname"
    oid = "RFC1213-MIB::sysName.0"
    is_tag = true

  [[inputs.snmp.table]]
    name = "snmp"
    inherit_tags = [ "hostname" ]
    oid = "IF-MIB::ifXTable"

    [[inputs.snmp.table.field]]
      name = "ifName"
      oid = "IF-MIB::ifName"
      is_tag = true
You can now test the configuration using the --test switch of telegraf.
telegraf --test

> snmp,agent_host=192.168.0.1,host=grafana-dev,hostname=asa-dev,ifName=Ethernet0/0 ifConnectorPresent=1i,ifCounterDiscontinuityTime=0i,ifHCInBroadcastPkts=16259i,ifHCInMulticastPkts=0i,ifHCInOctets=3634537092395i,ifHCInUcastPkts=3722891671i,ifHCOutBroadcastPkts=1813i,ifHCOutMulticastPkts=0i,ifHCOutOctets=1212254841127i,ifHCOutUcastPkts=2727986423i,ifHighSpeed=100i,ifInBroadcastPkts=0i,ifInMulticastPkts=0i,ifLinkUpDownTrapEnable=1i,ifName="Ethernet0/0",ifOutBroadcastPkts=0i,ifOutMulticastPkts=0i,ifPromiscuousMode=2i 1484840068000000000
Configure Grafana to show data
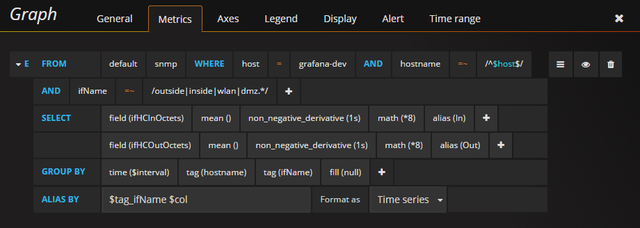
The fields ifHCInOctets and ifHCOutOctets count, how many Octects are received/send on the interfaces. To get a bit/sec value, we need to do some calculations in Grafana but thats rather straight forward.
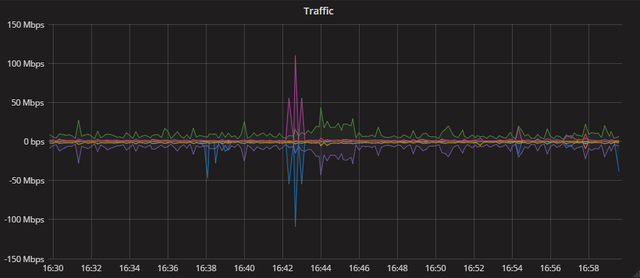
If everything works as expected, you should now see a graph as output.
Additional monitoring
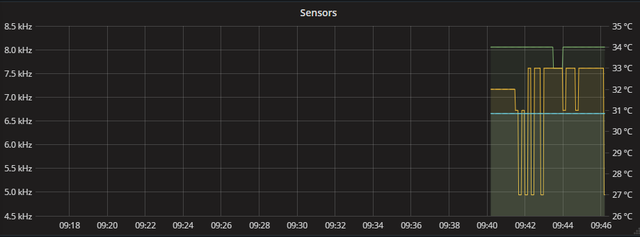
Sensors
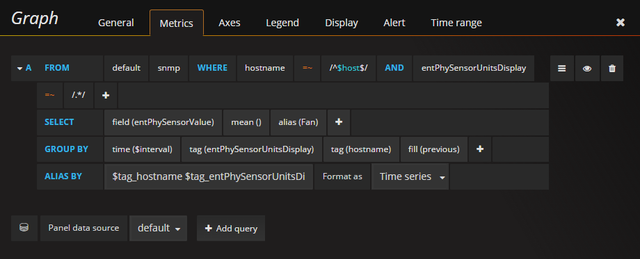
You can also add the internal temperature and fan sensors to your monitoring:
root@grafana-dev:/usr/share/snmp/mibs# snmptable -v 2c -c public asa-dev ENTITY-SENSOR-MIB::entPhySensorTable
SNMP table: ENTITY-SENSOR-MIB::entPhySensorTable

 entPhySensorType entPhySensorScale entPhySensorPrecision entPhySensorValue entPhySensorOperStatus           entPhySensorUnitsDisplay entPhySensorValueTimeStamp entPhySensorValueUpdateRate
              rpm             yocto                     0              6656                     ok                Chassis Cooling Fan             272:1:02:22.69              0 milliseconds
              rpm             yocto                     0              6656                     ok                Chassis Cooling Fan             272:1:02:22.69              0 milliseconds
              rpm             yocto                     0              6656                     ok                Chassis Cooling Fan             272:1:02:22.69              0 milliseconds
          celsius             yocto                     0                34                     ok             CPU Temperature Sensor             272:1:02:22.69              0 milliseconds
          celsius             yocto                     0                31                     ok Chassis Ambient Temperature Sensor             272:1:02:22.69              0 milliseconds
          celsius             yocto                     0                27                     ok Chassis Ambient Temperature Sensor             272:1:02:22.69              0 milliseconds
          celsius             yocto                     0                32                     ok Chassis Ambient Temperature Sensor             272:1:02:22.69              0 milliseconds
The matching configuration for telegraf is:
  [[inputs.snmp.table]]
    name = "snmp"
    inherit_tags = [ "hostname" ]
    oid = "ENTITY-SENSOR-MIB::entPhySensorTable"

    [[inputs.snmp.table.field]]
      name = "entPhySensorUnitsDisplay"
      oid = "ENTITY-SENSOR-MIB::entPhySensorUnitsDisplay"
      is_tag = true
Comments