Grafana: Monitor FHEM data with Telegraf and InfluxDB
Contents
Some years ago I decided to use FHEM as my home automation server. The main reasons are that it is really lightweight and provides many plugins to add sensors and interactors.
To visualize the data, I’m currently using some Munin plugins1.
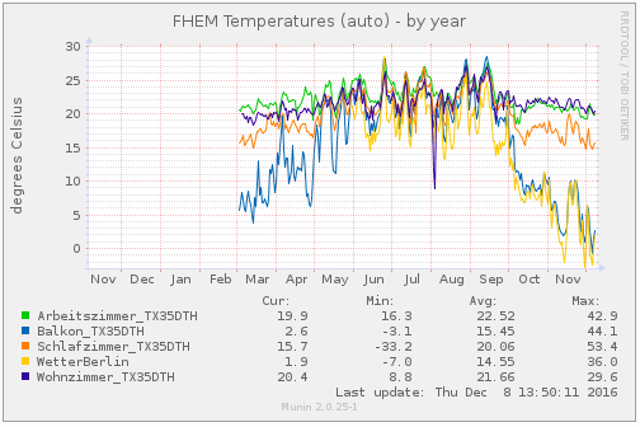
With this post, I’ll show how you can use InfluxDB, Telegraf and Grafana to display the graphs in a more fancy way.
FHEM uses Logfiles to store all of it’s data. So instead of writing a new Telegraf or FHEM plugin, we will use the logparser plugin with some custom configuration.
Requirements
All you need are running InfluxDB2, Telegraf3 and Grafana4 and FHEM5 installation.
Configuration
First of all you need to tell FHEM to log into a FileLog. The following snipped is an example which logs the output of the sensor Balkon_TX35DTH.
define FileLog_Balkon_TX35DTH FileLog ./log/Balkon_TX35DTH-%Y.log Balkon_TX35DTH
attr FileLog_Balkon_TX35DTH logtype text
attr FileLog_Balkon_TX35DTH room LaCrosse
After a restart of FHEM you should then see entries like this in your logfile:
2016-12-07_21:16:27 Balkon_TX35DTH battery: ok
2016-12-07_21:16:27 Balkon_TX35DTH temperature: 9.8
2016-12-07_21:16:27 Balkon_TX35DTH humidity: 66
2016-12-07_21:16:27 Balkon_TX35DTH T: 9.8 H: 66
You can now replace /etc/telegraf/telegraf.conf with this minimal configuration:
[[outputs.influxdb]]
  urls = ["http://localhost:8086"]
  database = "telegraf"

## Stream and parse log file(s).
[[inputs.logparser]]
  files = ["/opt/fhem/log/**TX35DTH-**.log"]
  from_beginning = true
  [inputs.logparser.grok]
   patterns = ["%{TEMP}", "%{HUM}"]
   measurement = "fhem"
   custom_patterns = '''
      TEMP %{DATA:timestamp:ts-"2006-01-02_15:04:05"} %{DATA:room:tag} temperature: %{NUMBER:temperature:float}
      HUM %{DATA:timestamp:ts-"2006-01-02_15:04:05"} %{DATA:room:tag} humidity: %{NUMBER:humidity:float}
   '''
As FHEM does not use a default time format, you need to configure a timeschema as shown above.
The cool thing here is, that FHEM stores historic data and by using the from_beginning switch you can tell telegraf to import all data. Depending on the size of your logfiles, that can take quite long.
I recommend to perform a --debug run to import all data, then change from_beginningto false and then restart Telegraf.
fhem@fhem:/opt/fhem/log# telegraf --debug
2016/12/07 21:19:35 I! Using config file: /etc/telegraf/telegraf.conf
2016/12/07 21:19:35 D! Attempting connection to output: influxdb
2016/12/07 21:19:35 D! Successfully connected to output: influxdb
2016/12/07 21:19:35 I! Starting Telegraf (version 1.1.1)
2016/12/07 21:19:35 I! Loaded outputs: influxdb
2016/12/07 21:19:35 I! Loaded inputs: inputs.logparser
2016/12/07 21:19:35 I! Tags enabled: host=fhem
2016/12/07 21:19:35 I! Agent Config: Interval:10s, Quiet:false, Hostname:"fhem", Flush Interval:10s
2016/12/07 21:19:35 Seeked /opt/fhem/log/Balkon_TX35DTH-2016.log - &{Offset:0 Whence:0}
2016/12/07 21:19:40 D! Input [inputs.logparser] gathered metrics, (10s interval) in 86.823µs
2016/12/07 21:19:41 I! Output [influxdb] wrote batch of 1000 metrics in 81.180784ms
2016/12/07 21:19:41 I! Output [influxdb] wrote batch of 1000 metrics in 85.264484ms
2016/12/07 21:19:42 I! Output [influxdb] wrote batch of 1000 metrics in 83.264431ms
Configure Grafana to show data
While telegraf is still importing your data, you can create some Grafana graphs.
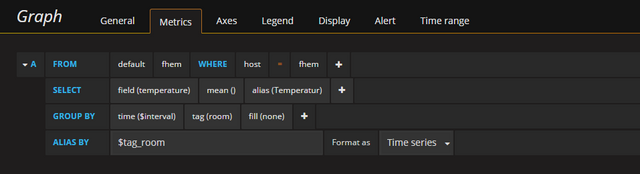
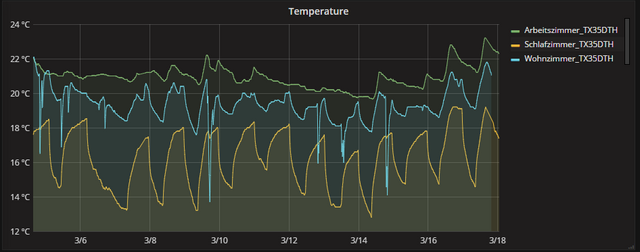
If everything works as expected, you should now see a graph as output.
Comments